August 22, 2026
How to Choose the Right Statistical Test for Non-Statisticians
Business Research, Research Tips, Statistics and Data Analysis, Uncategorized

One of the most common questions we get at StatAce isn’t about running a test. It’s about which test to run in the first place. If you’ve ever stared at your dataset wondering whether you need a t-test, ANOVA, chi-square, or regression, you’re not alone. Most graduate students weren’t trained as statisticians, and the textbooks rarely explain test selection in plain language.
This guide walks through the decision logic the way we actually think about it when a client sends us their data. No formulas up front, just the questions that narrow down your options.
Start With Three Questions
Before you touch SPSS, Jamovi, or R, answer these three questions about your study:
- What kind of variable is your outcome (dependent variable)? Is it a number (continuous), a category (nominal or ordinal), or a count?
- How many groups or variables are you comparing? One group against a benchmark, two groups, three or more groups, or the relationship between two continuous variables?
- Are your groups independent or related? Independent means different people in each group (e.g., males vs. females). Related means the same people measured more than once (e.g., pretest vs. post-test).
Once you can answer those three, the test almost picks itself.
The Decision Tree
Step 1: Is your outcome variable continuous (numeric) or categorical?
If continuous, go to Step 2. If categorical (yes/no, satisfied/dissatisfied, low/medium/high), jump to Step 4.
Step 2: How many groups are you comparing, and are they independent or related?
| Situation | Parametric Test | Non-Parametric Alternative |
|---|---|---|
| One group vs. a known value or standard | One-sample t-test | One-sample Wilcoxon test |
| Two independent groups | Independent samples t-test | Mann-Whitney U test |
| Two related groups (same people, twice) | Paired samples t-test | Wilcoxon signed-rank test |
| Three or more independent groups | One-way ANOVA | Kruskal-Wallis test |
| Three or more related groups (repeated measures) | Repeated measures ANOVA | Friedman test |
The parametric column assumes your data is roughly normally distributed and your groups have similar variances. If a normality test (like Shapiro-Wilk) or your sample size raises concerns, especially with small samples under 30, use the non-parametric alternative instead.
Step 3: Are you looking at the relationship between two continuous variables, or predicting one from several others?
| Situation | Test |
|---|---|
| Relationship between two continuous variables | Pearson correlation (or Spearman if not normally distributed) |
| Predicting one continuous outcome from one or more predictors | Linear regression |
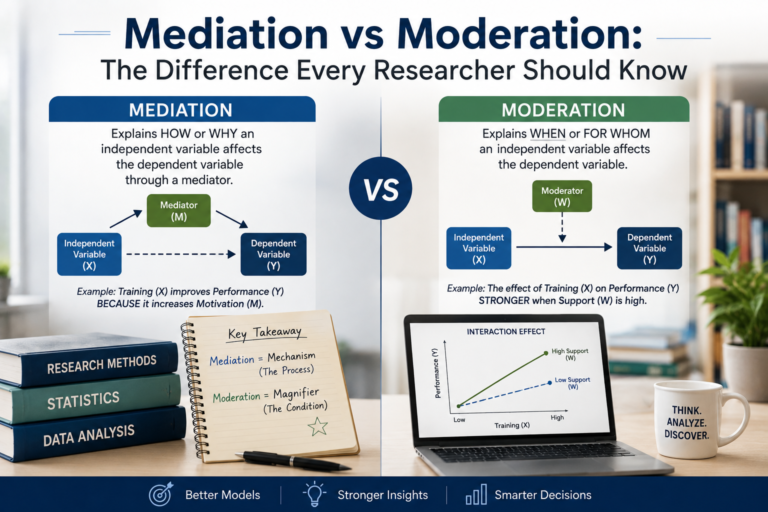
| Testing whether a variable mediates or explains the relationship between two others | Mediation analysis (often via regression or SEM) |
| Testing a full model with multiple constructs and indicators | Structural Equation Modeling (SEM) |
Step 4: Your outcome is categorical. How many categorical variables are involved?
| Situation | Test |
|---|---|
| Testing whether two categorical variables are associated | Chi-square test of independence |
| Comparing observed frequencies to an expected distribution | Chi-square goodness-of-fit test |
| Predicting a binary outcome (yes/no) from one or more predictors | Logistic regression |
| Predicting an outcome with more than two unordered categories | Multinomial logistic regression |
| Predicting an ordered categorical outcome (e.g., low/medium/high) | Ordinal logistic regression |
A Worked Example
Say your thesis compares job satisfaction scores (measured on a continuous scale) between teachers in public schools and teachers in private schools. That’s:
- Outcome variable: continuous (satisfaction score)
- Groups: two (public vs. private)
- Independent or related: independent (different teachers in each group)
Following the tree: independent samples t-test, or Mann-Whitney U if your satisfaction scores are heavily skewed or your sample per group is small.
Now say instead you’re looking at whether a teacher’s satisfaction score changes from before to after a professional development program.
- Outcome variable: continuous
- Groups: two (before and after)
- Independent or related: related (same teachers measured twice)
That’s a paired samples t-test, or a Wilcoxon signed-rank test if the assumptions aren’t met.
Common Mistakes We See
Choosing a test based on what your classmates used. Just because a previous thesis in your program used ANOVA doesn’t mean your data fits the same structure. Match the test to your actual design, not to precedent.
Skipping the assumption checks. Normality, homogeneity of variance, and independence of observations aren’t optional footnotes. Running a parametric test on data that clearly violates its assumptions is one of the fastest ways to get flagged during your defense.
Treating ordinal data (like 5-point Likert items) as if it were purely continuous without justification. Many researchers do treat Likert scale composites as continuous, and this is common practice in the social sciences, but it should be a deliberate, defensible choice rather than a default.
Confusing correlation with causation, or regression with experimental design. A regression model can tell you that a predictor is statistically associated with an outcome. It cannot, on its own, prove that one causes the other unless your design supports that claim.
When the Tree Isn’t Enough
Some studies don’t fit neatly into a single branch, especially those involving multiple dependent variables (MANOVA), nested or hierarchical data (multilevel modeling), or complex latent constructs (SEM, CFA). If your framework has moderators, mediators, or several interacting constructs, it’s worth getting a second opinion before you commit to an analysis plan, since redoing an entire dataset’s statistics after your proposal defense is far more painful than getting it right beforehand.
If you’re unsure which branch of the tree fits your study, or you’d like someone to check your analysis plan before you present it to your panel, that’s exactly the kind of question StatAce exists to help with.
Have a dataset you’re not sure how to analyze? Reach out to StatAce, we help Philippine graduate students and researchers choose the right statistical approach and get their studies defense-ready.
You might also like
Mediation vs Moderation: The Essential Difference Researchers Need
Read more →
Why Reliability Testing Quietly Decides Whether Your Research Can Be Trusted
Read more →
Leave a Reply